Measuring Website Performance with Playwright Test and Navigation Timing API

I was recently tasked with measuring the impact of a Redis cache on an e-commerce site. This was pretty simple with Azure Load Testing, by comparing the results of 2 sites, one with cache, and one without. However, to better exercise the site and understand the user experience, I wanted also to use Playwright.
Playwright already has useful features built in to report on things like the HTML report test step timing and the trace viewer that includes the call duration of each action.
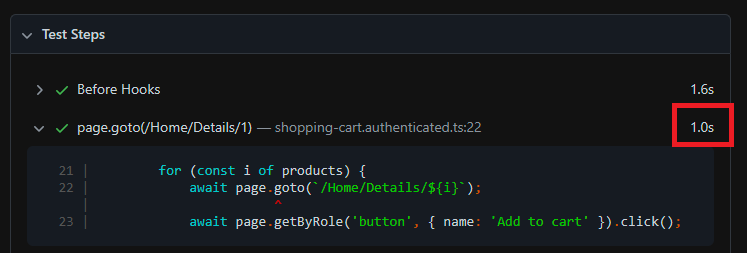
HTML report test step duration
I wanted to take this a step further by using the Navigation Timing API, measuring start to loadEventEnd. All of the examples I found online used performance.timing, which is now deprecated. This is a very simple code snippet, but posting this will hopefully help others find a solution faster.
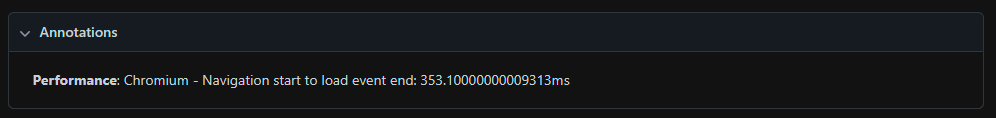
Here we have a function measurePerformance that can be called inside any test case to get navigation start to load event end times. This could easily be wrapped in a conditional to fail the test based on times. In my case, I just wanted it to be surfaced in the HTML report as a custom annotation to compare between sites, by toggling baseURL.
As a result, this is what the HTML report looks like:
Happy testing!