Ask an AI tool a data question and you’ll get an answer in seconds. It will sound finished. It might also be wrong. Maybe it used the wrong measure, skipped a filter everyone assumed was applied, or queried the wrong source entirely. Taking that answer at face value has a name: vibe analytics. It’s a riff on vibe coding, Andrej Karpathy’s term for letting AI write code and accepting it without reading the diffs.
I work at Microsoft on an analytics team supporting a large ecommerce business. Data isn’t the problem. We have plenty. The hard part is finding where it lives, stitching it together across reports and one-off spreadsheets, and turning it into a story. That part can be a pain in the ass.
So I built an AI analyst that moves fast and shows its work. Ask a focused question and it finds the governed semantic model that owns the answer. Ask for a broader briefing and it pulls evidence together from across the data landscape. Queries run under your own identity, and every answer comes with its sources, period, and filters. Want to see the query itself? Type show dax. The LLM handles the conversation. Institutional knowledge decides what counts as a correct answer.
It works alongside reports and human analysts, not instead of them. It makes the governed semantic models built on our Microsoft Fabric gold layer easier to use, cuts down on manual stitching, and captures what you need to know before you trust a number. That gives us more time to make decisions.
It started as a side project about three months ago. Now people across our org use it, so here’s how it works.
Using it
It handles three sizes of question in one place.
Small: a single metric. “What was yesterday’s value for Metric A?” It picks the right semantic model and hands you the number.
Medium: a health check. One command gets you a cross-source briefing across a set of business areas, with each line graded against a threshold. It answers “Is anything on fire right now?” on one screen.
Large: an executive readout. One prompt pulls data across each relevant model, grades each area against a performance framework, and writes a decision brief: what happened, why it matters, and what to do about it, ending in a ranked action list with owners.
I built the executive readout for people who need to turn a stack of reports into a leadership brief. Doing that manually means lining up the numbers, writing the narrative, and formatting the result. The agent can do that in a couple of minutes and attach the sources. Users can inspect the query behind any answer and verify its filters and measures.
Ask a plain-English question and the answer includes its receipt: the source, filters, and period used.
you: what was the value of Metric A in Region A last quarter?
analyst: Metric A in Region A was X.X units. Source: semantic model A | Filters: Region = Region A, Scenario = Actuals | Period: Previous quarter
Type show dax and it returns the query it ran. I replaced the real table and measure names in this example:
EVALUATE
ROW( "Metric A",
    CALCULATE(
        [Metric A],
        'Geography'[Region] = "Region A",
        'Calendar'[Relative Quarter] = "Previous Quarter"
    )
)
How it works
The LLM handles the conversation. Routing, model guidance, and query execution are what make the answers useful.
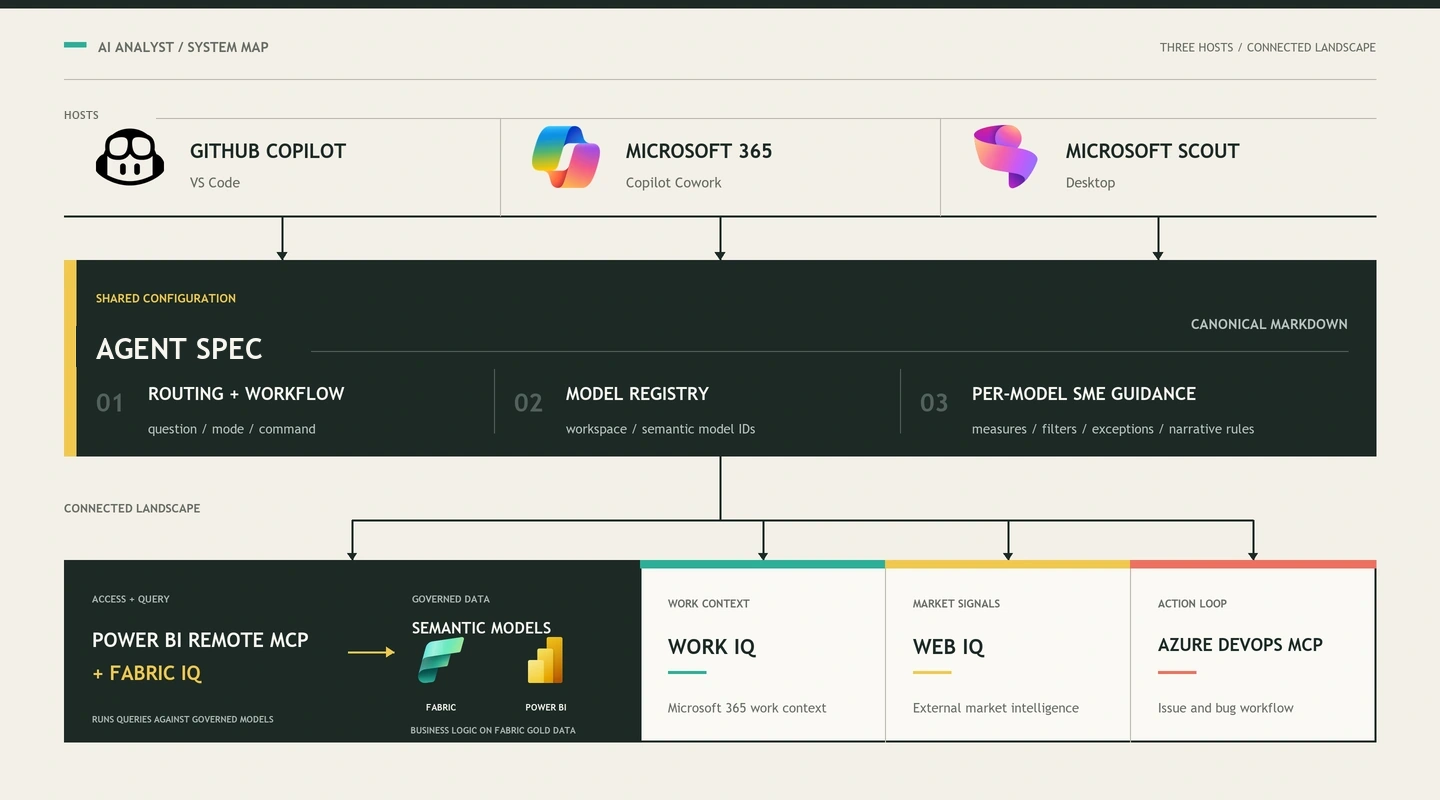
I support three hosts: GitHub Copilot, Microsoft 365 Copilot Cowork, and Microsoft Scout. I started with a GitHub Copilot custom agent wired up with several MCP servers. MCP, the Model Context Protocol, is the open standard that lets an agent talk to external tools in a consistent way.
The MCP servers
- The core is Power BI’s remote MCP server (in preview). It separates two steps: generating a DAX query from a plain-English question and executing it against a semantic model under your identity. For a one-off question, the server generates a query within guardrails supplied by the model guidance: the right measures and required filters. For bigger briefings, the agent runs prewritten DAX from those files.
- Other tools extend the workflow:
- The Azure DevOps MCP Server files a bug when something looks broken.
- Web IQ fetches external market intelligence.
- Work IQ brings in work context from Microsoft 365, such as files, meetings, mail, and chats. It runs under your identity and reaches content you can access.
The governed model
I rely on governed semantic models for trustworthy answers. We encode certified business logic and agreed definitions for core business measures in each model. Row-level security limits each user to the data they can access.
In a medallion architecture, data engineers store raw data in bronze tables, clean and conform it in silver, then shape it into business-ready gold tables. My team’s semantic models use that Microsoft Fabric gold layer. I built a thin natural-language layer that queries those models in place.
The analyst follows this path for each request:
Question agent routing registry and model guidance governed semantic model query result and source metadata answer or briefing
The main components
The agent file. Defines routing, workflow, and every mode and command.
A model registry. Maps each report to its exact workspace and semantic-model IDs. After the agent chooses a model, the registry resolves the target up front, so the agent does not wander around discovering what exists at runtime.
Per-model guidance. One prompt file per report, in plain Markdown, encodes the institutional knowledge: which filters must always be present, how measure names differ across tables, which dimension value looks like a total but is not, and which measures must never feed a narrative. These files carry the accumulated product knowledge; the LLM provides a flexible interface.
The exact rules vary by model, but a sanitized sketch of the shape looks like this:
## Required filters
- Scope: required on every query
- Scenario: Actuals

## Measure guidance
- Metric A: use the certified measure
- Never narrate from measures listed as unsafe
The execution layer. The Power BI remote MCP server runs the query in GitHub Copilot; Fabric IQ runs it in Cowork.
One brain, three front doors
I shipped it first as the GitHub Copilot custom agent. The first practical question was, “Great, how do I use this without opening an IDE?”
It has three front doors:
- The GitHub Copilot custom agent in VS Code, with the full set of MCP servers.
- A plugin for Microsoft 365 Copilot Cowork, which uses Fabric IQ for Power BI access.
- A plugin for Microsoft Scout, an OpenClaw-like desktop app for Windows and macOS that acts across your files, shell, browser, and Microsoft 365. Scout supports a compatible agent-and-plugin shape built on the GitHub Copilot CLI, so I ported the Markdown files with few changes; the plugin adds the MCP servers the host does not ship.
The agent file and per-report prompt files form one canonical spec. A script generates the Scout desktop plugin from it by rewriting the front matter, re-anchoring file paths, and transforming the MCP configuration for that host. The Cowork edition reuses the same prompt files. These hosts are converging on the same basic shape: MCP for tools plus similar agent and skill formats. I can keep the host-specific glue small.
Where it is going
Next, I plan to host it as a Foundry hosted agent. Foundry Agent Service can run a packaged agent on managed infrastructure that handles scaling and session state. I could publish a hosted version to Microsoft Teams and Microsoft 365 Copilot Chat, where people already work.
I also plan to add data sources and connect the analyst to daily workflows.
Stuff I learned
Institutional knowledge took most of the work. A bare LLM can return a plausible but wrong number. I spent most of the effort writing down or referencing the institutional knowledge that makes an answer correct.
“Show me the query” makes review concrete. People do not trust a black box, and they are right not to. Letting someone inspect the filters and measures does more for trust than a claim about accuracy can.
Static checks protect the contract today. For relevant changes, CI checks that golden questions route to the right model, model files keep their required filters, known-bad measures stay quarantined, and safety sections remain intact. The checks need no credentials or live queries and run in seconds. They catch regressions before the analyst starts returning garbage.
End-to-end trace evals are next. The next tier will record real runs, check generated DAX for required filters, and trace each narrative number to a query result. I need unattended agent runs to build those evals, another reason to host it on Foundry.
Adding another supported semantic model requires configuration. It needs a registry entry, per-model guidance, and routing and eval cases. I wrote a CONTRIBUTING.md with step-by-step instructions and practices that make the process repeatable.
Wrapping up
This is how I want data questions to work: ask in plain English, pull the answer from the right governed models, and keep the evidence attached. Each answer keeps its source, filters, and query attached for review.
If you are building something similar, I would love to compare notes on how you encode business rules and keep the work reviewable.